When you need to handle the huge data, you want to make the workflow which finish the processing quickly. In that case, how to make the workflow is very important for a peace ful afternoon. But you need to know which tool is slow or fast to make the efficiently workflow. Fortunately, the Alteryx Designer have a very nice function “Performance Profiling”, which can tell us the consumption time of each tool’s processing.
You can enable this function on the Runtime tab at the Workflow configuration. It is disabled by default because this function consume the processing power.
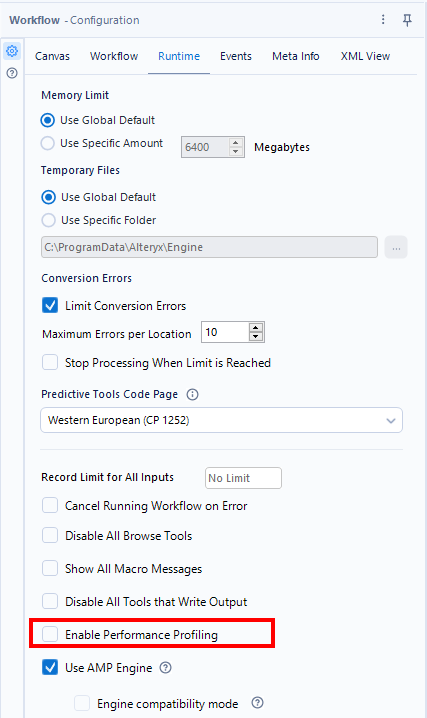
After turn on this function, the Designer shows you how long each tool takes to process. However, the whole processing time increse because the Designer measure the processing time of each tool. So, you should turn on that function only if you want to know the processing time.
Let’s see that effect. To turn on the Performance Profiling, it shows you the Profiling Time on the Result window.
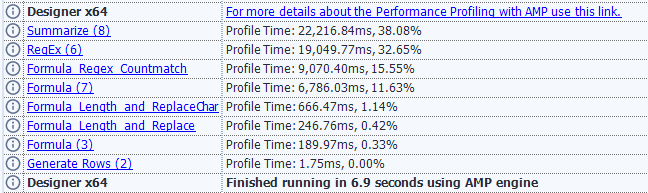
The consumption time of each tool is shown as “Profile Time” in millisecond unit and also the ratio of the whole processing time is shown.
For example, this is the workflow for bentimarking. The Formula tools on the right output the same result. The contents of the process is counting the character “#” in the string.
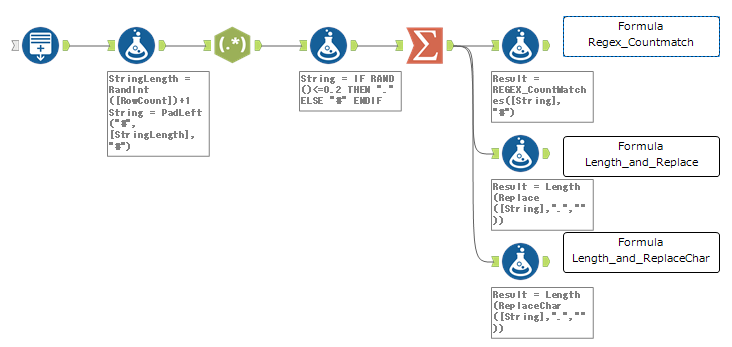
The Formula tool “Formila Regex_Countmatch” on the top has the formula below.
REGEX_CountMatches([String], "#")The second Formula tool “Formula Length_and_Replace” has the fomula below.
Length(Replace([String],".",""))The Fomula tool “Formula Length_and_ReplaceChar” on the bottom has as follows.
Length(ReplaceChar([String],".",""))Let’s see the difference from the each fomula’s speed by the Performance Profiling.
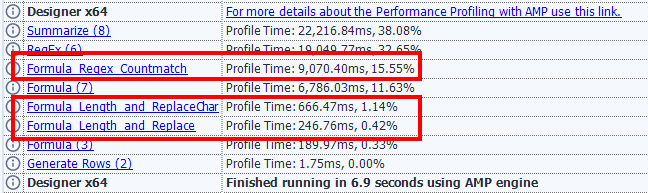
- REGEX_CountMatch 15.55%
- The combination of the ReplaceChar and Length 1.14%
- The combination of the Replace and Length 0.42%
This means that the REGEX_COUNTMATCH is slower than other fomulas. But that formula is very useful for the complex problem. If the real problem is very complex, please consider using it as well even if the processing speed is slow.
Note that if you turn on the AMP Engine, the measument time is not strict. Please read this article “Performance Profiling with AMP Engine”.
Please don’t forget to disable the Performance Profiling after the tuning the workflow. It mekes the workflow be slower while the enebled.
Sample workflow Download
Contents of the next blog
At the next blog, I will handle the functions, not tool.
コメント