The principal component analysis is useful for dimensionality reduction. In the Alteryx, we can do PCA using the Principal Components tool.

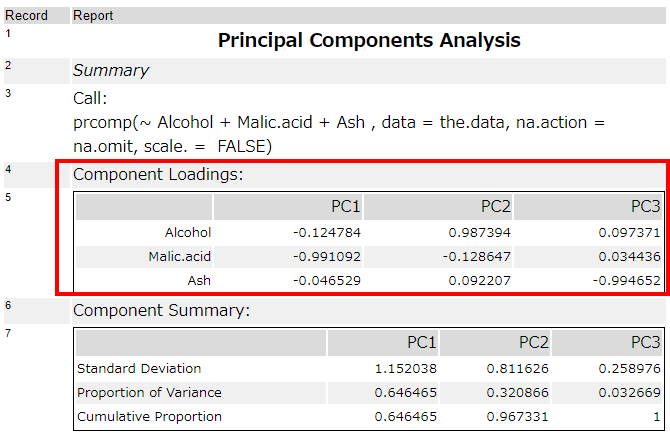
Let’s see the report of the Principal Components tool.
Some data is placed as the table data. How can we get those data?
What is the Alteryx reports?
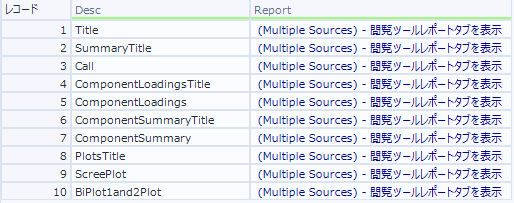
The Principal Components tool have O-output and R-output. However, O-output doesn’t have principal component loading. Next, let’s see the R output. When you see the R output, you can find the principal component loading. But it is contained in the “Report”. The actual output as follows.
What we want is the 5th record. The principal component loading is contained with “Report” field. Let’s double click that field. After that, you can see as follow.
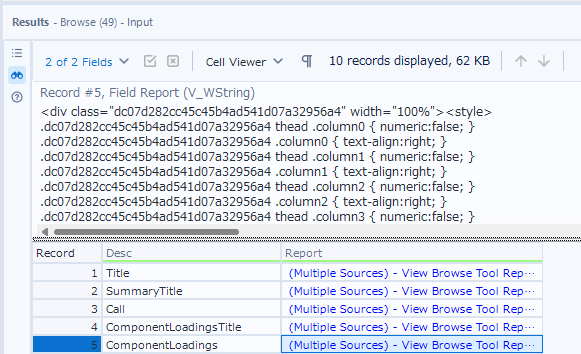
The “Report” field’s contents is written as HTML like format. In other words, we can get what we want parsing this field’s contents.
Extract coefficients from principal component analysis report
Let’s look at Alteryx report table structure. Basically, the whole table is placed in “datatable” tag. And column name is in “tr class=”HeaderRow” “. Each column is surrounded by “td” tag. Regarding the data rows, they are surrounded by “dbody” tag and each data row is places in “dr” tag. Finally, each data is surrounded by “cell” tag.
<datatable>
<tr class="headerRow"><td>Column1</td><td>Column2</td></tr>
<dbody>
<dr><cell>Datavalue1-1</cell><cell>Datavalue2-1</cell></dr>
<dr><cell>Datavalue1-2</cell><cell>Datavalue2-2</cell></dr>
<dbody>
</datatable>
Red : Culumn Name, Blue : Data
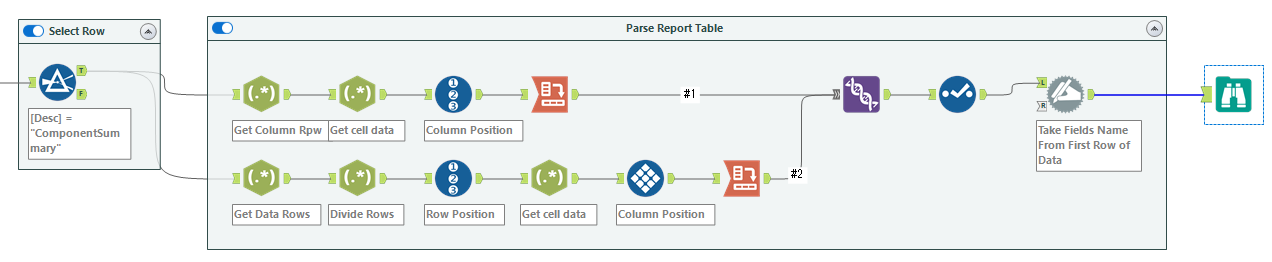
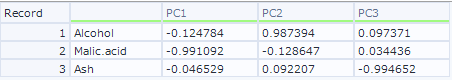
Please see the workflow if you want to know the detail. This workflow finally outputs the below result.

コメント